

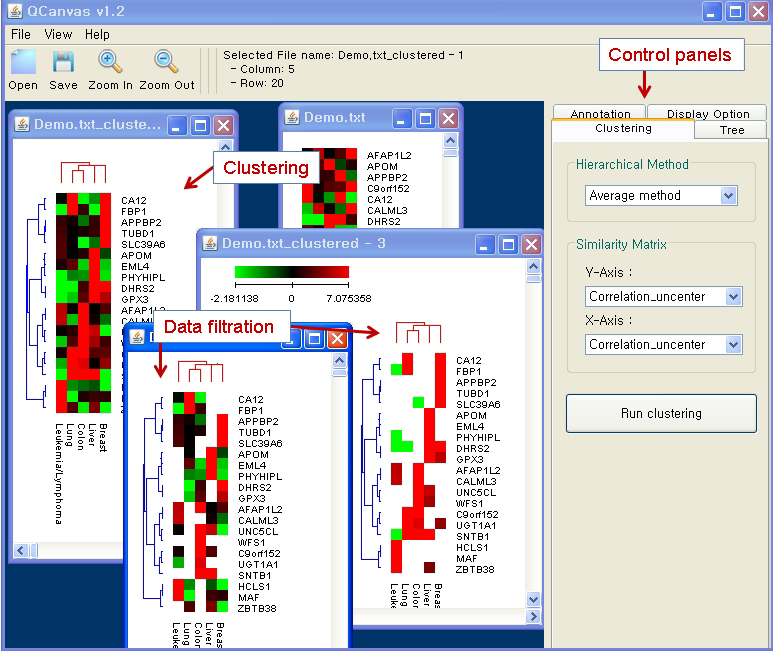
We have developed a user-friendly, interactive software to cluster and visualize genomics or proteomics data. It provides diverse algorithms for hierarchical clustering of two dimensional data. The clustering result can be interactively visualized and optimized on a heatmap. The present tool does not require any prior knowledge on scripting language to carry out the data clustering and visualization. Furthermore, additional dataset can be overlaid on the analysis of a given dataset. For example, a clustered heatmap of experimental data can be differentially visualized by using a statistical confidence such as p-values. Including diverse menu-based display options, QCanvas provides a convenient tool for pattern analysis and high quality image generation. It is possible to change the color, position and size of data cells, labels and trees. Clustered heatmaps can be saved in a postscript file.
Comparison between QCanvas and Cluster 3.0 was done on Windows 7 32 bit, 2GB RAM, Intel Core 2 Quad CPU 2.4GHz. Cluster 3.0 is a clustering software and Java TreeView is needed to view the clustering results generated by Cluster 3.0. For three testing files, two softwares show similar performance for biclustering of complete linkage method. For a large matrix, Cluster 3.0 gives a little bit better performance than QCanvas. However, QCanvas offers a handy clustering and visualization of genomics/proteomics data in an integrated way.
| QCanvas | Cluster | |
| image_4786_28.txt | 3:03 | 3:01 |
| gsk_5000_100.txt | 3:25 | 3:30 |
| gsk_5000_318.txt | 4:13 | 3:46 |
| image_4786_28.txt (1.6MB) | siRNA-high content screening image data; a matrix of size 4786 siRNAs × 28 morphological descriptors |
| gsk_5000_100.txt (2.6MB) | GlaxoSmithKline released gene expression data; a matrix of size 5000 gene probes × 100 cell lines |
| gsk_5000_318.txt (8.3MB) | GlaxoSmithKline released gene expression data; a matrix of size 5000 gene probes × 318 cell lines |